A Norwegian project, initiated and financed by the Norwegian Seafood Research Fund (FHF) and led by SINTEF calculated the climate footprint of the farmed salmon industry over its full life cycle, from production and sourcing of salmon feed to the delivery of end products to various markets around the world. The project has recently released its findings, summarized in a report. The work was carried out by SINTEF Ocean, Asplan Viak and RISE Research Institutes of Sweden during the period December 2021 to December 2022.
Feed production as a major source of emissions
Researchers used Life Cycle Assessment (LCA) methodology, complimented by the Environmentally Extended Input-Output Analysis (EEIO), to complete their calculations. The products used were fresh and frozen whole salmon and salmon filets shipped to markets in Europe, the US and Asia, either by truck, sea or air.
Results show emission values between 4.8 and 28 kg CO2e per kg edible salmon on the market. These results confirm previous findings about important emission drivers, such as air freight and feed production, the latter of which represents 75% of the total farmgate emissions. In contrast, slaughtering and processing contribute to less than 2% of the total carbon footprint for all products, and packaging accounts for 1-5%.
The project also evaluated five overarching areas for improvement (feed, loss, production system, distribution and energy source) and 19 specified measures across the whole value chain. These elements were evaluated with regard to emissions and costs to identify the most cost-effective improvement measures. Results showed that the emission reduction potential of the specified measures varied from 19% lower emissions to 29% higher emissions compared to the base case, with more detailed results of the evaluations summarized in the report.
Monitoring development over time
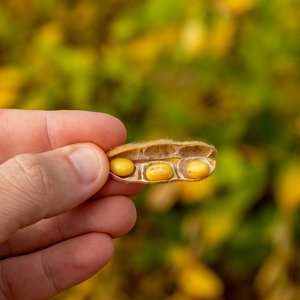
In order to understand how these emission levels have evolved over time, a comparison was done within this report using consistent methods. This comparison shows an emission reduction of around 10% since 2017. This is partly due to a reduction in the use of soy protein from countries with expanded land use and the inclusion of other crop-based proteins with lower climate intensities, showing that the industry is continuously working towards making choices with a lower carbon footprint.
Check out the results here.